Particle Calorimeter
A binned calorimeter of the amount of kinetic energy per solid angle and energy-per-particle.
The solid angle bin is solely determined by the particle’s momentum vector and not by its position, so we are emulating a calorimeter at infinite distance.
The calorimeter takes into account all existing particles as well as optionally all particles which have already left the global simulation volume.
External Dependencies
The plugin is available as soon as the libSplash and HDF5 libraries are compiled in.
.param file
The spatial calorimeter resolution can be customized and in speciesDefinition.param. Therein, a species can be also be marked for detecting particles leaving the simulation box.
.cfg file
All options are denoted exemplarily for the photon (ph) particle species here.
| PIConGPU command line option | Description |
|---|---|
--ph_calorimeter.period |
The ouput periodicity of the plugin.
A value of 100 would mean an output at simulation time step 0, 100, 200, …. |
--ph_calorimeter.file |
Output file suffix. Put unique name if same species + filter is used multiple times. |
--ph_calorimeter.filter |
Use filtered particles. All available filters will be shown with picongpu --help |
--ph_calorimeter.numBinsYaw |
Specifies the number of bins used for the yaw axis of the calorimeter.
Defaults to 64. |
--ph_calorimeter.numBinsPitch |
Specifies the number of bins used for the pitch axis of the calorimeter.
Defaults to 64. |
--ph_calorimeter.numBinsEnergy |
Specifies the number of bins used for the energy axis of the calorimeter.
Defaults to 1, i.e. there is no energy binning. |
--ph_calorimeter.minEnergy |
Minimum detectable energy in keV.
Ignored if numBinsEnergy is 1.
Defaults to 0. |
--ph_calorimeter.maxEnergy |
Maximum detectable energy in keV.
Ignored if numBinsEnergy is 1.
Defaults to 1000. |
--ph_calorimeter.logScale |
En-/Disable logarithmic energy binning. Allowed values: 0 for disable, 1 enable. |
--ph_calorimeter.openingYaw |
opening angle yaw of the calorimeter in degrees.
Defaults to the maximum value: 360. |
--ph_calorimeter.openingPitch |
opening angle pitch of the calorimeter in degrees.
Defaults to the maximum value: 180. |
--ph_calorimeter.posYaw |
yaw coordinate of the calorimeter position in degrees.
Defaults to the +y direction: 0. |
--ph_calorimeter.posPitch |
pitch coordinate of the calorimeter position in degrees.
Defaults to the +y direction: 0. |
Coordinate System
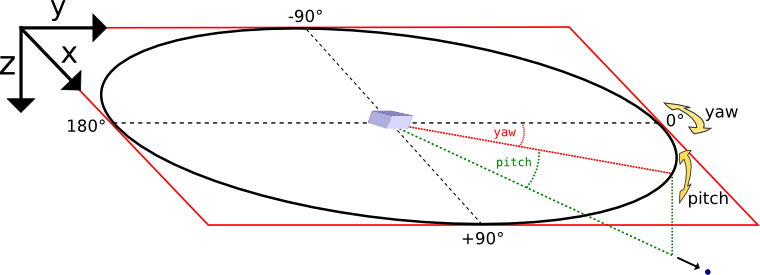
Yaw and pitch are Euler angles defining a point on a sphere’s surface, where (0,0) points to the +y direction here. In the vicinity of (0,0), yaw points to +x and pitch to +z.
Orientation detail: Since the calorimeters’s three-dimensional orientation is given by just two parameters (posYaw and posPitch) there is one degree of freedom left which has to be fixed.
Here, this is achieved by eliminating the Euler angle roll.
However, when posPitch is exactly +90 or -90 degrees, the choice of roll is ambiguous, depending on the yaw angle one approaches the singularity.
Here we assume an approach from yaw = 0.
Tuning the spatial resolution
By default, the spatial bin size is chosen by dividing the opening angle by the number of bins for yaw and pitch respectively.
The bin size can be tuned by customizing the mapping function in particleCalorimeter.param.
Memory Complexity
Accelerator
each energy bin times each coordinate bin allocates two counter (float_X) permanently and on each accelerator for active and outgoing particles.
Host
as on accelerator.
Output
The calorimeters are stored in hdf5-files in the simOutput/<species>_calorimeter/<filter>/ directory.
The file names are <species>_calorimeter_<file>_<sfilter>_<timestep>_0_0_0.h5.
The dataset within the hdf5-file is located at /data/<timestep>/calorimeter.
Depending on whether energy binning is enabled the dataset is two or three dimensional.
The dataset has the following attributes:
| Attribute | Description |
|---|---|
unitSI |
conversion factor from calorimeter value to Joule. |
maxYaw[deg] |
half of the opening angle yaw. |
maxPitch[deg] |
half of the opening angle pitch. |
posYaw[deg] |
yaw coordinate of the calorimeter. |
posPitch[deg] |
pitch coordinate of the calorimeter. If energy binning is enabled: |
minEnergy[keV] |
minimal detectable energy. |
maxEnergy[keV] |
maximal detectable energy. |
logScale |
boolean indicating logarithmic scale. |
Note
This plugin is a multi plugin. Command line parameters can be used multiple times to create e.g. dumps with different dumping period. In the case where an optional parameter with a default value is explicitly defined the parameter will be always passed to the instance of the multi plugin where the parameter is not set. e.g.
--ph_calorimeter.period 128 --ph_calorimeter.file calo1 --ph_calorimeter.filter all
--ph_calorimeter.period 1000 --ph_calorimeter.file calo2 --ph_calorimeter.filter all --ph_calorimeter.logScale 1 --ph_calorimeter.minEnergy 1
creates two plugins:
- calorimeter for species ph each 128th time step with logarithmic energy binning.
- calorimeter for species ph each 1000th time step without (this is the default) logarithmic energy binning.
Attention
When using the plugin multiple times for the same combination of species and filter, you must provide a unique file suffix.
Otherwise output files will overwrite each other, since only species, filter and file suffix are encoded in it.
An example use case would be two (or more) calorimeters for the same species and filter but with differing position in space or different binning, range, linear and log scaling, etc.
Analysis Tools
The first bin of the energy axis of the calorimeter contains all particle energy less than the minimal detectable energy whereas the last bin contains all particle energy greater than the maximal detectable energy. The inner bins map to the actual energy range of the calorimeter.
Sample script for plotting the spatial distribution and the energy distribution:
f = h5.File("<path-to-hdf5-file>")
calorimeter = np.array(f["/data/<timestep>/calorimeter"])

# spatial energy distribution
# sum up the energy spectrum
plt.imshow(np.sum(calorimeter, axis=0))
plt.show()

# energy spectrum
# sum up all solid angles
plt.plot(np.sum(calorimeter, axis=(1,2)))
plt.show()